Three methods, deliberately sequenced
The research program was designed as a three-phase mixed-methods study, each method building on the last, following an initial deep dive for building a solid foundation of understanding. The secondary research and parallel set of in-depth interviews with outside subject matter experts — academics specializing in cross-cultural youth studies, and marketing professionals who focus specifically on Gen Z audiences — supplied the macro context underneath the data: how economic and political uncertainty has shaped this generation’s default skepticism, why brand loyalty runs in the opposite direction from prior generations (loyalty flows from the brand to the customer, not the reverse), and just how much internal diversity sits inside a single generational cohort — particularly across India’s tiered cities, where Gen Z in smaller tier-two and tier-three markets looks meaningfully different from their tier-one peers. That context kept the core research from over-generalizing a group that isn’t nearly as monolithic as “Gen Z” suggests.
I co-led the research together with one other researcher, both of us reporting into a design lead who ran the overall program.
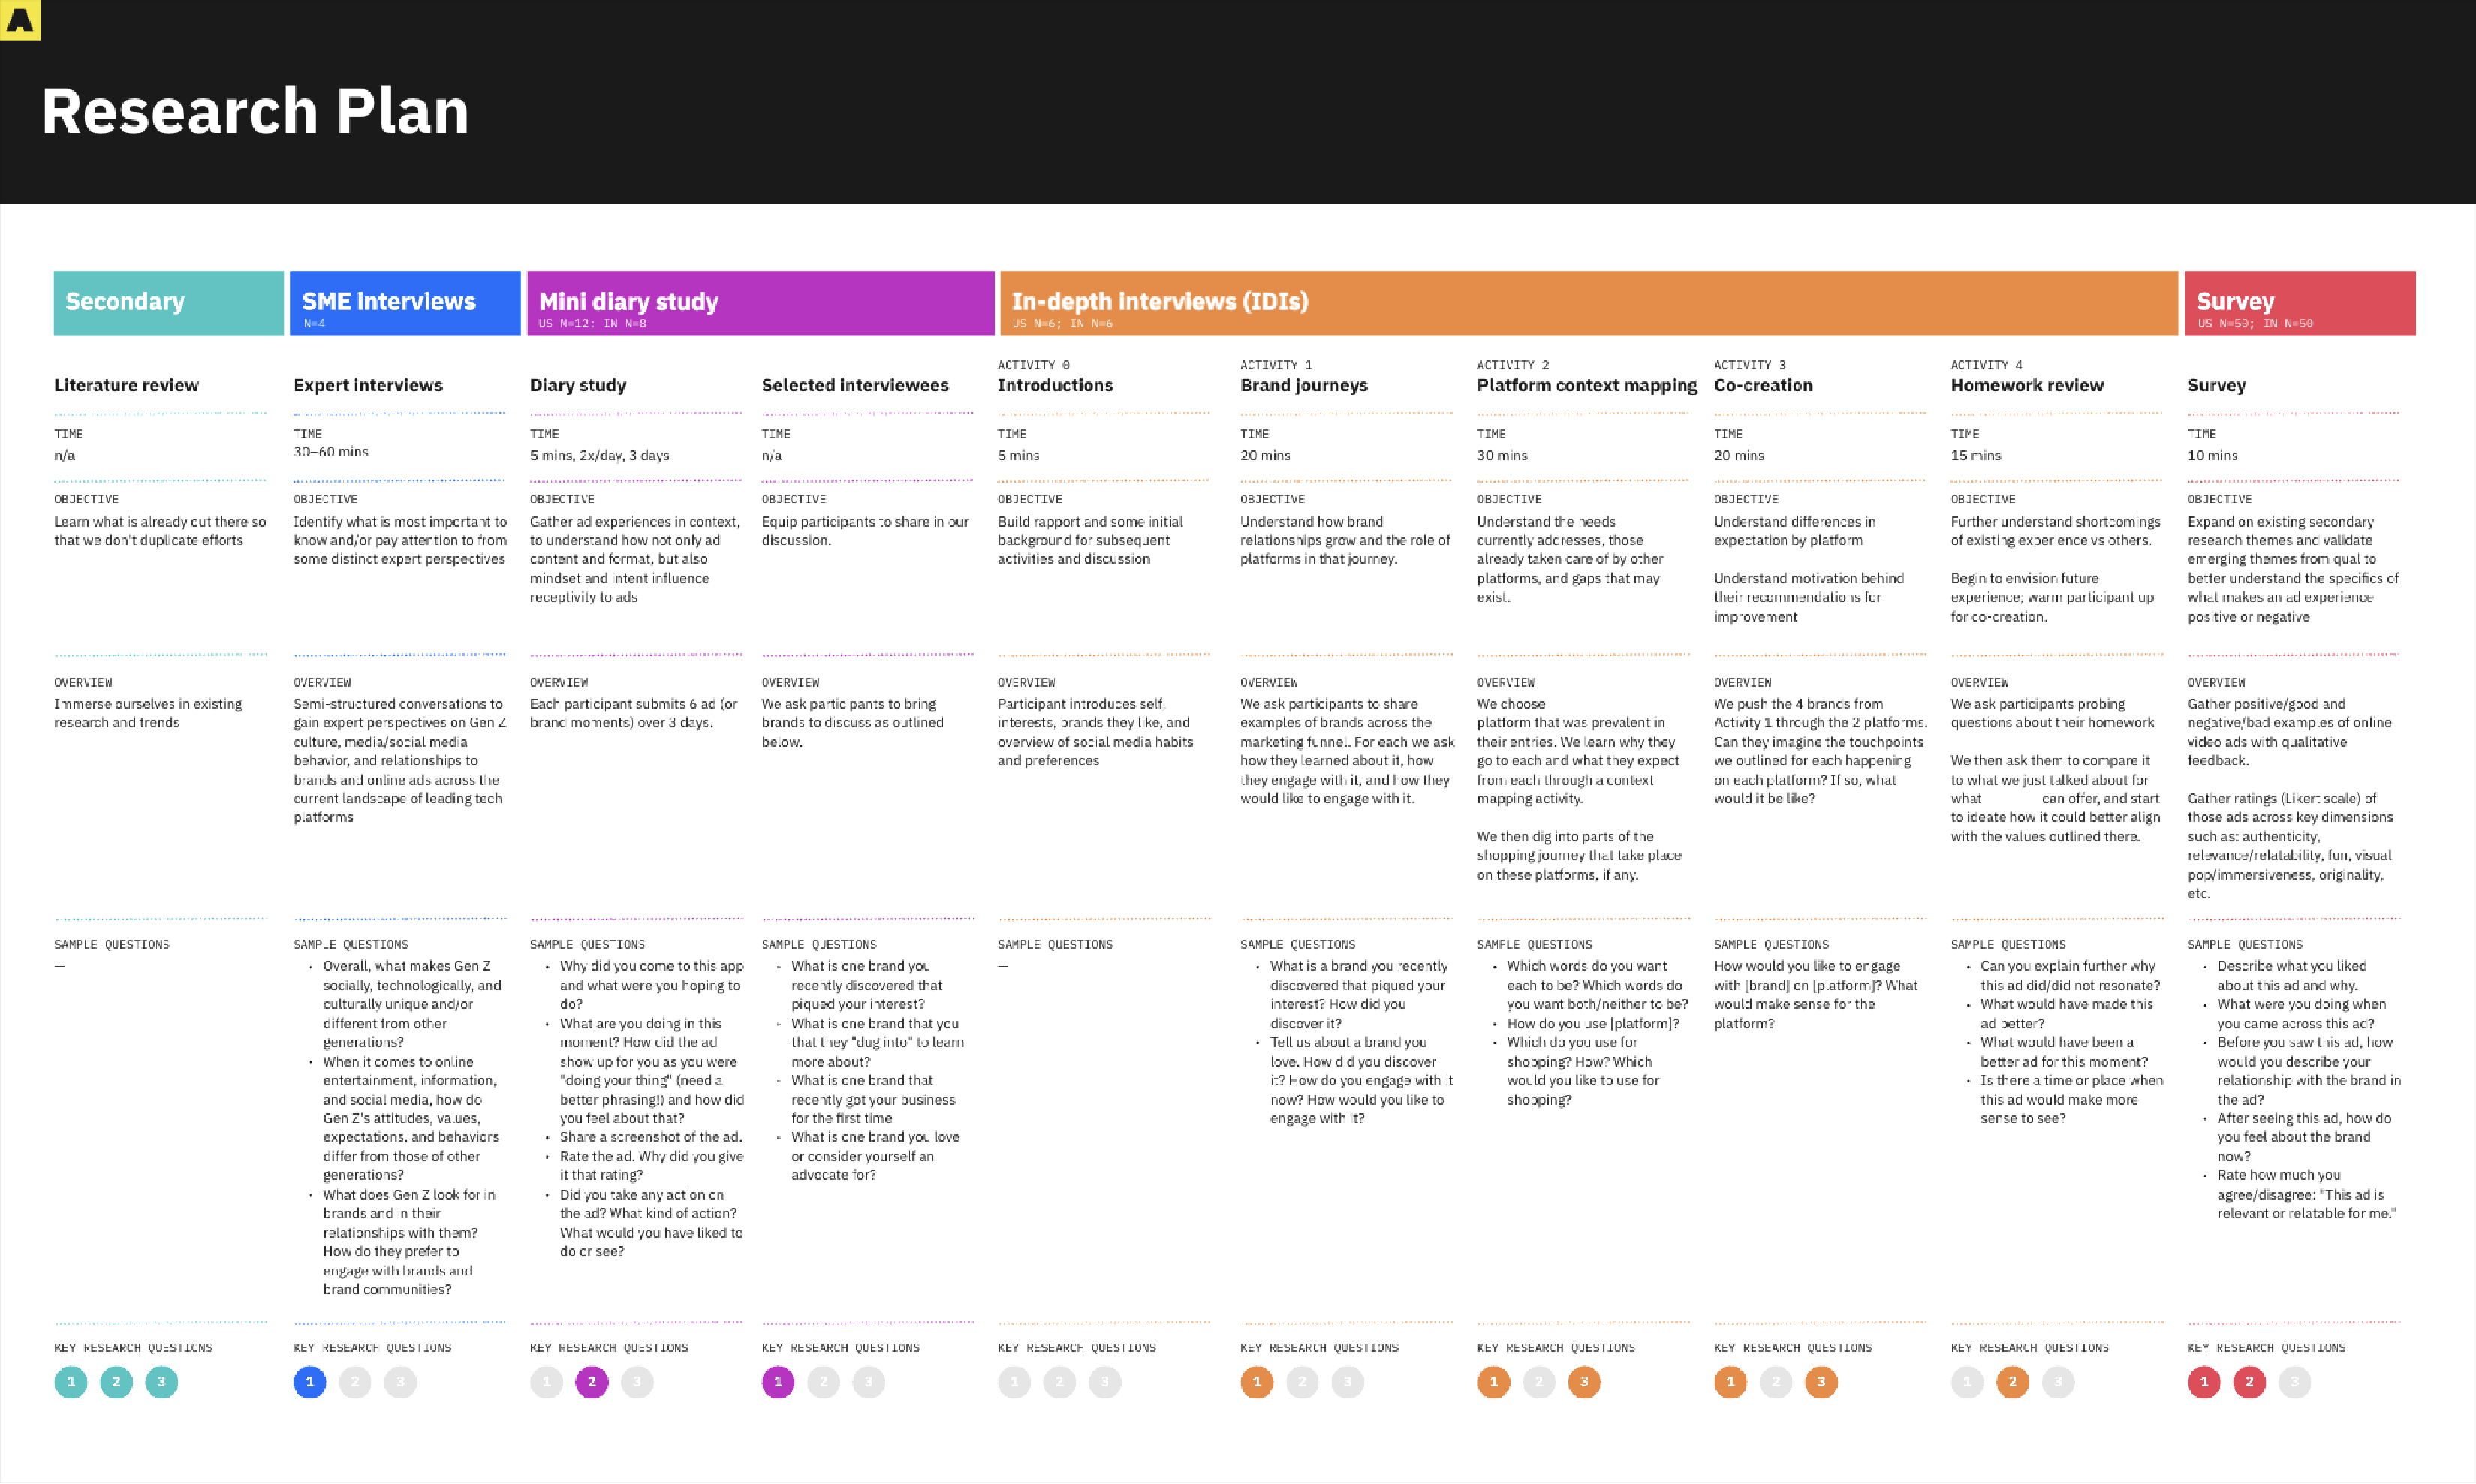
The three-phase mixed-methods research plan built on a foundation of secondary research and subject matter expert interviews: a mini diary study, in-depth interviews, and a closing survey
A mini diary study (n=21) opened the program; participants documented their ad experiences in context, over time, capturing what made an encounter feel positive or negative in the moment rather than in retrospect. This gave us naturalistic data that retrospective interviews alone would have missed: the small friction points, the moments of unexpected relevance, the reflexive swipe-past behaviors.
In-depth interviews (n=12) went deeper, exploring how participants experienced ads across multiple platforms and what they imagined a genuinely better experience might look like. These sessions moved beyond behavior into aspiration — valuable territory for a platform trying to improve rather than just optimize what it already had.
A quantitative survey (n=98, split US/India) then tested whether the themes emerging from the qualitative work held at scale, building confidence where patterns were consistent and surfacing divergence where US and Indian respondents differed meaningfully. Nine ad experience attributes were evaluated: relevance, trustworthiness, brevity, discoverability, native integration, content relationship, emotional versus informational emphasis, action ease, and social connectivity.
Data visualization was a meaningful part of the output, where I used open source rawgraphs.io to produce sentiment maps of how participants described the platform’s ads, segmented by market. The visual contrast between US and India responses was, for example, immediate and legible in a way that tables of percentages weren’t.
Importance ratings across 9 ad attributes, combined and by market
Sentiment bubble maps built in rawgraphs.io: positive vs. negative descriptors